UX Monitoring & Telemetry Platform
Real-Time User Experience & Error Log Analytics
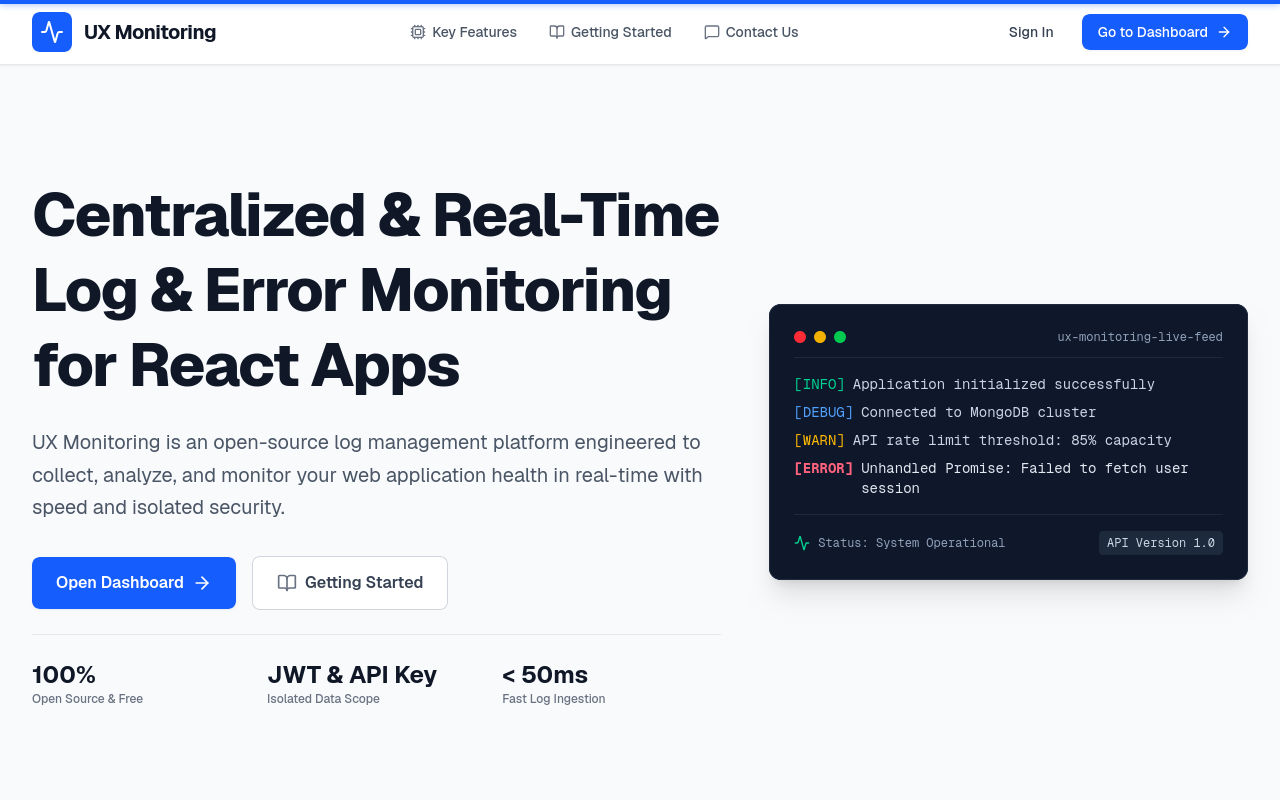
Full-stack real-time telemetry dashboard for monitoring web application errors, user session health, latency spikes, and API response logs.
Active Online
Live Dashboard
< 50ms
Ingest Latency
100% Type-Safe
Data Integrity
Executive Overview & Context
UX Monitoring is an independent telemetry software system built to capture client-side error stack traces, route transition speeds, and user session health metrics across production web apps.
The Problem & Challenge
Developers often discover production JavaScript runtime errors only after users complain. Generic analytics lack actionable stack traces, environment metadata, and session timeline context.
Engineering Solution & Architecture
Created a Next.js App Router application backed by PostgreSQL and Prisma ORM. Frontend apps transmit lightweight error payloads to an ingest endpoint, which aggregates events into visual dashboards using Recharts.
Key Features Breakdown
Real-Time Telemetry Dashboard
Live overview displaying error frequencies, browser breakdown, OS distribution, and HTTP status codes.
Stack Trace & Environment Inspector
Deep-dive view showing exact source code line numbers, user agent strings, URL routes, and request headers.
Latency & Performance Profiling
Tracks page load times (Core Web Vitals) and API endpoint response durations over time.
Technical Architecture
Frontend & UI
Backend & Database
Deployment
UI & Feature Contribution
Daniel Kamasi designed and integrated key frontend UI components, responsive flows, and custom backend modules.